Virtual Try-On API Pricing: How to Forecast Usage and Cost
By the ZeDaq.ai team · · 6 min read
On this page
- What does the API actually meter?
- Which plan limits should you plan around?
- How do you forecast usage in four steps?
- What does a worked example look like?
- How do you read the example result?
- When does a higher plan cost less than staying small?
- How do you forecast body-scan measurements?
- How do you keep costs predictable?
- What about stores that are not on Shopify?
- Does the first-month offer change the forecast?
To forecast virtual try-on API usage and cost, multiply your monthly product-page sessions by the share of visitors who start a try-on, add a buffer for retries, then pick the plan whose monthly cap covers the total. Because renders are the metered part, this one number drives your bill.
This guide gives you a formula, a worked example with made-up inputs, and a table of ZeDaq.ai plan limits checked against the pricing page on November 10, 2026. If you are still choosing an approach, start with our virtual try-on API guide for developers.
What does the API actually meter?
According to the API reference, POST /api/v1/tryon costs 1 try-on, and POST /api/v1/scan costs 1 measurement. The size-chart lookup is free. A render that returns 202 is only charged once it succeeds.
So you forecast two numbers: try-on renders and body-scan measurements. Failed renders and pending polls do not add to the first one.
Which plan limits should you plan around?
These are the plan limits shown on the pricing page at the time of writing. Check the page again before you commit.
| Plan | Price | Try-ons a month | Measurements a month |
|---|---|---|---|
| Free | $0 | 3 | 3 |
| Micro | $14/mo | 20 | 30 |
| Starter | $49/mo | 75 | 100 |
| Growth | $129/mo | 650 | Unlimited |
| Scale | $299/mo | 2,000 | Unlimited |
Every paid plan has a 3-day free trial with no card required. Monthly try-on and measurement caps depend on your plan, as the API reference notes.
How do you forecast usage in four steps?
Step 1: Count sessions on pages with try-on
Use your analytics to count monthly sessions on the product pages where you will show try-on. Start with one category, such as dresses, rather than the whole catalog.
Step 2: Estimate the share who start a try-on
You do not have a measured rate before launch, so run a low, medium and high guess. Do not borrow a rate from a vendor or a blog. Replace the guess with your own number after the first month.
Step 3: Add retries
Some shoppers will run more than one render, for example to try a second color. Use a multiplier for renders per user, and test a low and a high value.
Step 4: Add a buffer
Add a margin for peak weeks such as a sale. The size of the buffer is your own planning choice, not a statistic.
What does a worked example look like?
All inputs below are invented to show the arithmetic. They are not benchmarks, and they are not results from any store.
| Input | Low | Medium | High |
|---|---|---|---|
| Monthly sessions on try-on pages | 2,000 | 2,000 | 2,000 |
| Share who start a try-on | 2% | 5% | 10% |
| Users who try on | 40 | 100 | 200 |
| Renders per user | 1 | 2 | 3 |
| Renders before buffer | 40 | 200 | 600 |
| Renders with a 25% buffer | 50 | 250 | 750 |
In this example, the low case fits inside the Starter plan's 75 renders. The medium case needs Growth, and the high case needs Scale, because 750 is above Growth's 650.
The range is wide on purpose. It tells you that your first month is a measurement exercise, not a final answer.
How do you read the example result?
Read the three columns as a range, not a prediction. Which column is likeliest depends on your traffic, your button placement and how you describe the feature to shoppers.
Three habits make the range narrower over time:
- Log every call your server makes to the API, with the status code and the plan you were on.
- Compare renders with sessions each week, so you learn your real start rate.
- Separate launch weeks from normal weeks, because campaigns change the pattern.
After one full month, replace the guesses with measured numbers and run the table again.
When does a higher plan cost less than staying small?
Compare the plan price with how often you hit the cap. If you repeatedly run out of try-ons on a smaller plan, shoppers see an error message at the moment they are most interested. A plan with more headroom is cheaper than lost goodwill.
The reverse is also true. If you use a small share of a large plan for three months in a row, move down. Plans are monthly, so you can adjust without a long commitment.
Judge the plan on try-ons and measurements first, since those are the limits an API integration actually uses.
Also set an internal alert at a fixed share of the cap, such as when you pass the halfway point mid-month. An early warning gives you time to upgrade before shoppers see a cap error.
How do you forecast body-scan measurements?
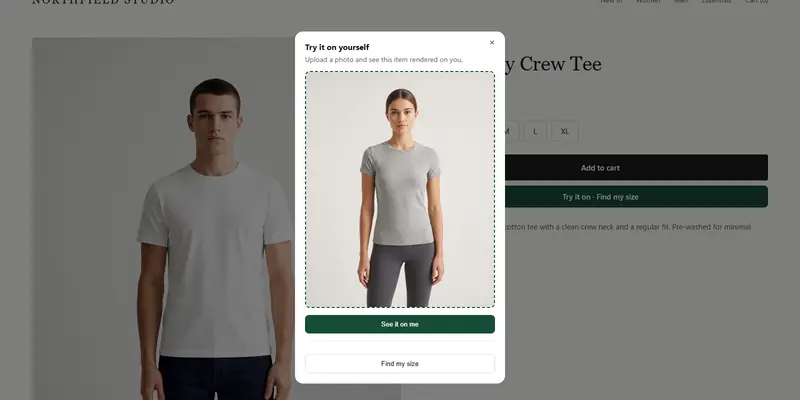
Size scans are counted separately. If you use the scan, estimate the share of shoppers who tap "Find my size", then multiply by sessions. On Growth and Scale, measurements are unlimited per the pricing page, so this only matters on the smaller plans.
The scan runs on the shopper's device and only measurements are sent for sizing. A shopper who scans and then tries on uses one measurement and one render.
How do you keep costs predictable?
- Show the button where it counts. Start on high-return categories before the whole store.
- Require a photo before the render. The shopper chooses to proceed, so you do not render by accident.
- Watch the cap warnings. The API returns
tryon_cap_reachedwhen the monthly allowance is used up, so show a friendly message. - Review monthly. Compare real usage with your forecast and move plans up or down.
For a small store, the question may be simpler. Read what virtual try-on costs a small fashion store. For the three ways vendors charge, see virtual try-on pricing models explained.
What about stores that are not on Shopify?
The same math applies to the script-tag widget and the API. A WooCommerce store, for example, can use the widget, which needs a key locked to the store's domain. Our guide to virtual try-on for WooCommerce shows the options.
Does the first-month offer change the forecast?
It only changes the first bill. First-month prices apply to monthly plans only, once per store or business, on its first paid plan. For example, Micro is $1 for the first month, then $14 a month. Forecast against the regular price.
Start with real usage numbers
FAQs
Are failed renders charged?
The API reference says a render is only charged once it succeeds. A 202 response means the job is pending, and you poll until it finishes.
What happens when I hit my monthly cap?
The API returns a tryon_cap_reached error. Show shoppers a short message and consider moving up a plan.
Do size lookups cost anything?
The GET /api/v1/size-chart lookup is listed as free. Body scans through POST /api/v1/scan use 1 measurement each.
How often should I recheck my forecast?
Check after the first month and after each campaign. Replace your guesses with real session and render counts.
Try ZeDaq.ai free
Virtual try-on and Find my size for your store, plus client, order and invoicing tools for tailors, in one subscription.