How to Use Shopify Analytics to Find Fit Problems by Product
By the ZeDaq.ai team · · 4 min read
On this page
To find fit problems by product in Shopify, compare each product's sales with its returns, break the returns down by size and reason, and look for products that stand out. A product with many returns in one size usually has a size chart or fit note problem, not a demand problem.
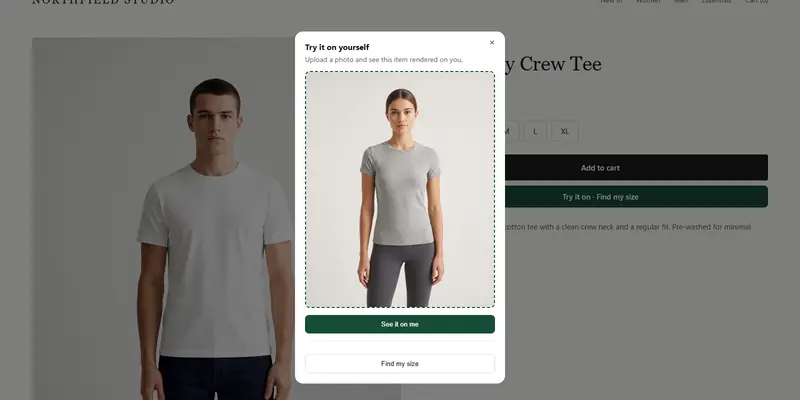
Shopify groups its default reports into categories, including sales, inventory and orders. Once you know which products leak sales, tools like virtual try-on on your Shopify store can help shoppers choose a size.
What data do you need to spot fit problems?
You need three things for every product: how many sold, how many came back, and why. Without the reason, a return is just a number.
- Sales by product and size. Which variants sell.
- Returns by product and size. Which variants come back.
- Return reasons. What customers wrote or selected.
Shopify's report list can be filtered by Created by: Shopify to show only its default reports. Open the sales and order categories to see what your plan includes, since the help page does not list plan availability.
How do you compare returns across products?
Build a simple table in a spreadsheet. Export your sales and returns data, then list one row per product.
| Product | Units sold | Units returned | Return share | Top reason |
|---|---|---|---|---|
| Example row | From sales report | From returns data | Returned ÷ sold | From return notes |
Sort by return share, then look at the top of the list. A new product with a high share may just have a small sample. Check products with enough sales to trust the pattern.
How do you find which size is the problem?
Repeat the table by size for any product that stands out. The pattern tells you what to fix.
- Mostly returns in the smallest sizes: the item may run small, or the chart is too generous.
- Mostly returns in the largest sizes: the item may run large.
- Returns spread across all sizes: the issue may be fabric, color or description rather than fit.
- Returns in two adjacent sizes: your chart ranges may overlap or leave a gap.
Our guide to fixing a size chart after a spike in returns shows how to adjust ranges once you know the size.
How do you read return reasons?
Group the reasons into a few buckets: too small, too large, not as described, changed mind and defective. Count each bucket per product.
"Too small" and "too large" are fit signals. "Not as described" points to your photos and copy. Our walkthrough on analyzing return reasons by product goes through the method in more detail.
What can you change once you find the problem?
Match the fix to the cause:
- Update the product description with fit notes such as "runs small, size up". See how to write product descriptions for clothing.
- Correct the size chart for that garment type.
- Add a size recommendation so shoppers get a suggestion from your chart. ZeDaq.ai does this from a 30-second body scan.
- Read customer reviews for fit comments. Review tools are compared in the best Shopify product review apps for clothing brands.
Make one change per product, then check again after the next batch of orders. If you change several things at once, you will not know which one worked.
How do you prioritize which products to fix first?
You cannot fix everything at once. Rank products by how much they matter, then start at the top.
- Products that sell the most and also have a high return share.
- Products with the same fit reason repeated in return notes.
- Products with a clear single cause you can fix today, such as a wrong chart range.
Leave low-volume products until you have more data. A tidy log of what you changed and when makes it easy to compare before and after.
How do fit tools compare with analytics?
Analytics tells you where fit goes wrong. A sizing tool tries to prevent it on the next order. If you are weighing sizing vendors, our comparison of True Fit vs Fit Analytics is a place to start.
Keep tracking the same table every month. The goal is to see your worst products move down the list, and to catch new problem products early after each launch.
Help shoppers choose a size before they order
FAQs
Which Shopify report shows returns by product?
Check the reports under the sales and order categories in your Shopify admin. Which reports you see depends on your plan, so review your own Reports list.
How many orders do I need before the data is useful?
Enough that one odd order does not change the picture. Compare products with a reasonable number of sales rather than brand-new ones.
Can analytics tell me if a size chart is wrong?
It can point to it. If returns cluster in one size or two adjacent sizes, check that chart range first.
Do I need an app to track fit?
No. A spreadsheet and your return notes are enough to start. An app can save time once you have many products.
Try ZeDaq.ai free
Virtual try-on and Find my size for your store, plus client, order and invoicing tools for tailors, in one subscription.