How to Use Heatmaps on a Fashion Store
By the ZeDaq.ai team · · 4 min read
On this page
To use heatmaps on a fashion store, pick one important page such as a product page, collect enough visits, then read where shoppers click, scroll and stop. A heatmap is a picture of that behavior, colored from cool to hot. It shows what shoppers do, not why, so pair it with other checks.
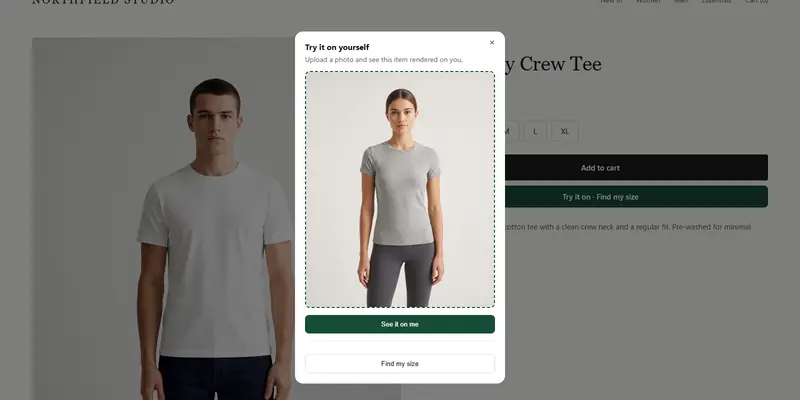
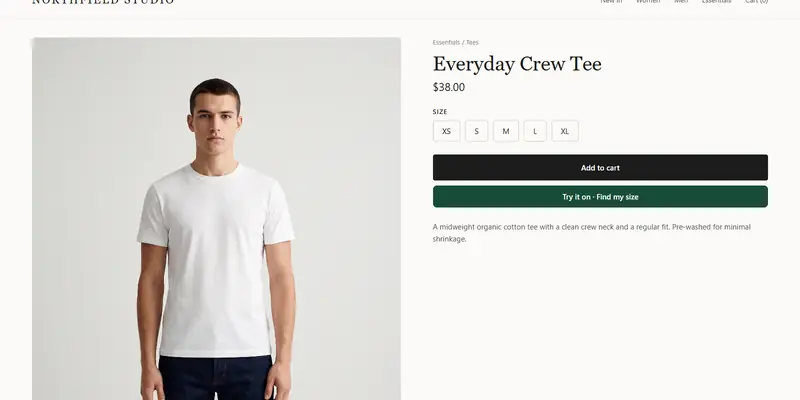
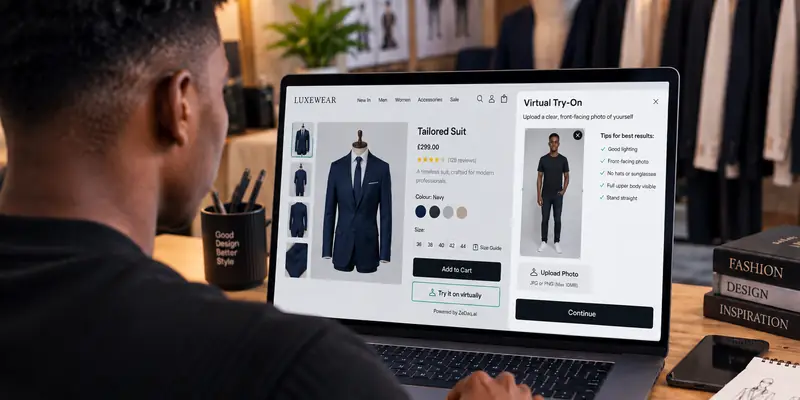
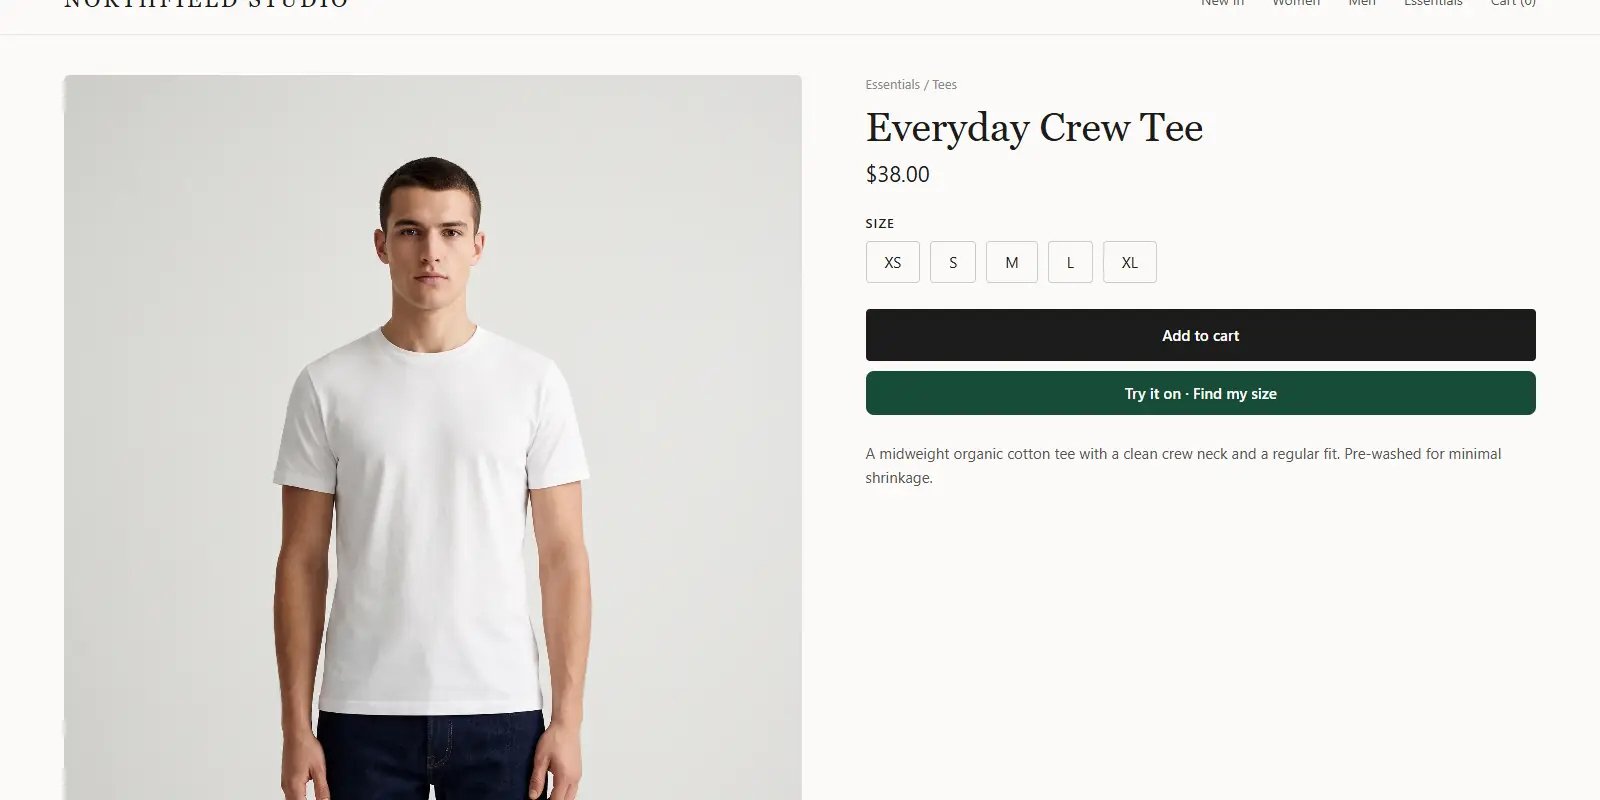
This guide is for Shopify store owners who want to improve product pages. If sizing questions show up in your findings, adding virtual try-on to Shopify is one way to answer them on the page.
What types of heatmaps are there?
- Click maps show where visitors click or tap, including things that are not links.
- Scroll maps show how far down a page visitors get.
- Move maps show where desktop cursors travel. These are less useful on phones.
- Session recordings replay a single visit. They are not heatmaps, but they explain what a heatmap shows.
Heatmap tools differ in features and pricing, so check each provider's own website before choosing.
What should you look at on a product page?
Do shoppers find the size information?
If the size chart link gets many clicks, shoppers may be unsure about fit. That is a signal to make sizing clearer, rather than a problem on its own.
Do shoppers scroll to reviews and details?
A scroll map shows where attention drops. If most visitors never reach fabric, shipping or returns information, move the key points higher. For ideas on what to put first, see the guide to Shopify product page layout for fashion.
Are shoppers tapping things that do nothing?
On mobile, taps on a photo or a color swatch that is not clickable suggest confusion. Make those elements work or change their look.
How do you run a heatmap test step by step?
- Choose one page type, such as your best-selling product page.
- Install your chosen tool following its own instructions.
- Collect data for long enough to cover a normal week of traffic, including weekends.
- Look at mobile and desktop separately, since fashion traffic often leans mobile.
- Write down three observations, such as "few reach the returns section."
- Change one thing, then compare the new heatmap.
Changing several things at once makes results hard to read.
How do you read a heatmap on a phone?
Most fashion shoppers browse on phones, so read the mobile map first. Look for three patterns:
- A hot area near the top. Shoppers are probably studying the main photo. Make sure it is sharp and that swiping through images works.
- A cold band in the middle. If scrolling slows there, the content may be too long or repetitive.
- Clusters of taps on small text. The tap targets may be too tiny, so enlarge them.
Then open three or four session recordings for the same page. Watch for hesitation, back-and-forth scrolling between photos and the size chart, or repeated taps. Those moments show where a shopper is stuck.
What changes are worth testing first?
Choose changes that answer a shopper's doubt:
- Move the size guide link closer to the size selector.
- Add a short fit note near the price, such as "true to size" if that is accurate for your products.
- Show returns and delivery details above the fold.
- Add more photos of the fabric and the back of the garment.
- Make the main button easy to see without scrolling.
Change one item at a time and keep notes with dates. Without notes, it is hard to tell which change made a difference. Use your own sales and add-to-cart numbers to judge results.
What are common mistakes?
- Too little traffic. A handful of visits can mislead.
- Mixing devices. Phone and desktop layouts differ, so they need separate maps.
- Ignoring context. A hot click on a size chart could mean confusion or healthy interest. Check recordings and customer messages.
- Using heatmaps to guess intent. They show behavior only. Ask shoppers directly through a short survey or by reading support questions.
Can heatmaps help with returns?
They can point to where fit information is weak, but they cannot measure returns. Compare what you learn with your return reasons. The guide to return fraud in fashion ecommerce covers a different return problem worth separating from fit issues.
If your pages cover niche products, see how to sell bridal dresses on Shopify or print-on-demand t-shirts, where shoppers need different information.
Do heatmaps affect privacy?
Yes. Session tools can record visitor behavior, so update your privacy policy, follow the consent rules for your region, and make sure the tool hides form fields such as payment details.
Answer the size question on the product page
FAQs
How much traffic do I need for a heatmap?
There is no fixed number. More visits give steadier patterns, so wait until a page has seen a good share of typical weekly traffic before drawing conclusions.
Are heatmaps better than Google Analytics?
They answer different questions. Analytics counts visits and sales, while heatmaps show where attention goes on a page.
Can heatmaps slow down my store?
Tracking scripts add some load. Test your store speed before and after installing one.
Should I use heatmaps on every page?
No. Start with product pages and your cart, then expand if you find issues worth fixing.
Try ZeDaq.ai free
Virtual try-on and Find my size for your store, plus client, order and invoicing tools for tailors, in one subscription.