How to Set a Realistic Returns Target
By the ZeDaq.ai team · · 4 min read
On this page
Set your returns target from your own data, not from a headline number. Measure your current return rate by product and by reason, separate the returns you can prevent from those you cannot, and then aim to shrink the preventable share.
A single store-wide percentage hides most of what matters. This guide gives a step-by-step method. One of the biggest preventable causes in fashion is size, which is why many stores start with AI size recommendation.
What is a good return rate to compare against?
There is no single "good" rate, but industry figures give context. The National Retail Federation (NRF) and Appriss Retail reported that the total return rate for 2023 was 14.5% of sales, and that for online sales it was higher, with 17.6% of merchandise purchased online returned (NRF, 2023 Consumer Returns in the Retail Industry).
Treat this as a rough reference for all retail, not a target for a fashion store. Apparel categories, price points and customer groups differ, and these are averages across many types of retailers.
Why shouldn't you copy an industry average?
An average mixes stores with very different products. A store selling fitted dresses faces different return pressure from one selling scarves.
Three problems come up when you copy a benchmark:
- It ignores your mix. Categories with sizing risk return more than accessories.
- It ignores your policy. Free returns and long windows change shopper behavior.
- It hides the cause. A rate tells you how much came back, not why.
Use the benchmark as a sanity check only. Your own trend over time is the better yardstick.
How do you measure your own return rate?
Use a simple formula, and keep the definition fixed so months compare fairly.
- Choose a period. Use whole months, and note the date range.
- Count returned units or value. Pick one and stick to it.
- Divide by units or value sold in the same period. Use orders from the same cohort where you can, because returns often arrive weeks later.
- Repeat by product, category and size.
A spreadsheet is enough. The guide to analyzing return reasons by product shows how to break the numbers down.
How do you separate preventable returns from the rest?
Not every return is a failure. Some are normal, such as a gift the recipient did not want. Others point to a fix.
Sort your return reasons into groups:
| Group | Examples | Can you reduce it? |
|---|---|---|
| Fit and size | Too small, too large | Often, with better size data |
| Not as described | Color or fabric differs | Often, with better photos and copy |
| Quality | Defect, damage | Sometimes, with supplier checks |
| Preference | Changed mind, gift | Rarely |
Your target should focus on the groups you can influence. Our article on color mismatch returns covers one common "not as described" cause.
How do you turn this into a target?
Set targets in layers instead of one number.
- Baseline. Your current rate over the last few full months.
- Product-level watch list. Products whose rate is clearly above your store's rate.
- Reason-level goal. A direction for the preventable groups, such as "fewer size-related returns this quarter."
- Review date. Revisit monthly at first, then quarterly.
Avoid promising a specific percentage drop until you have a baseline and a plan. A target with no plan is only a wish. Feeding return data back into your sizing and product pages is covered in returns and size data feedback loops.
What does a simple tracking sheet look like?
Keep one row per returned item, so you can count by any column later. These columns are enough to start:
| Column | Why it helps |
|---|---|
| Order date and return date | Shows how long returns take to arrive |
| Product and size | Finds problem products and problem sizes |
| Reason code | Separates fit, description, quality and preference |
| Refund or exchange | Shows what you kept |
| Cost of the return | Shows what each group really costs |
Use a fixed list of reason codes so staff pick the same wording every time. Our guide to return reason codes shows how to set them up.
After a few months, you will see which products and reasons make up most of your returns. That is the list your target should be built on.
What actions move the number?
Match each action to the reason it addresses:
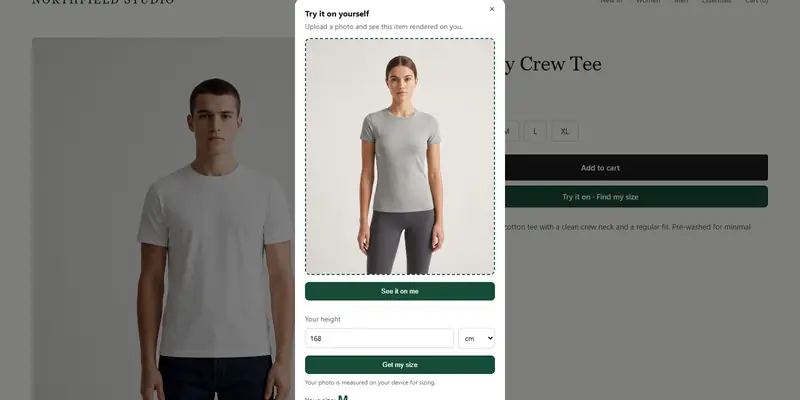
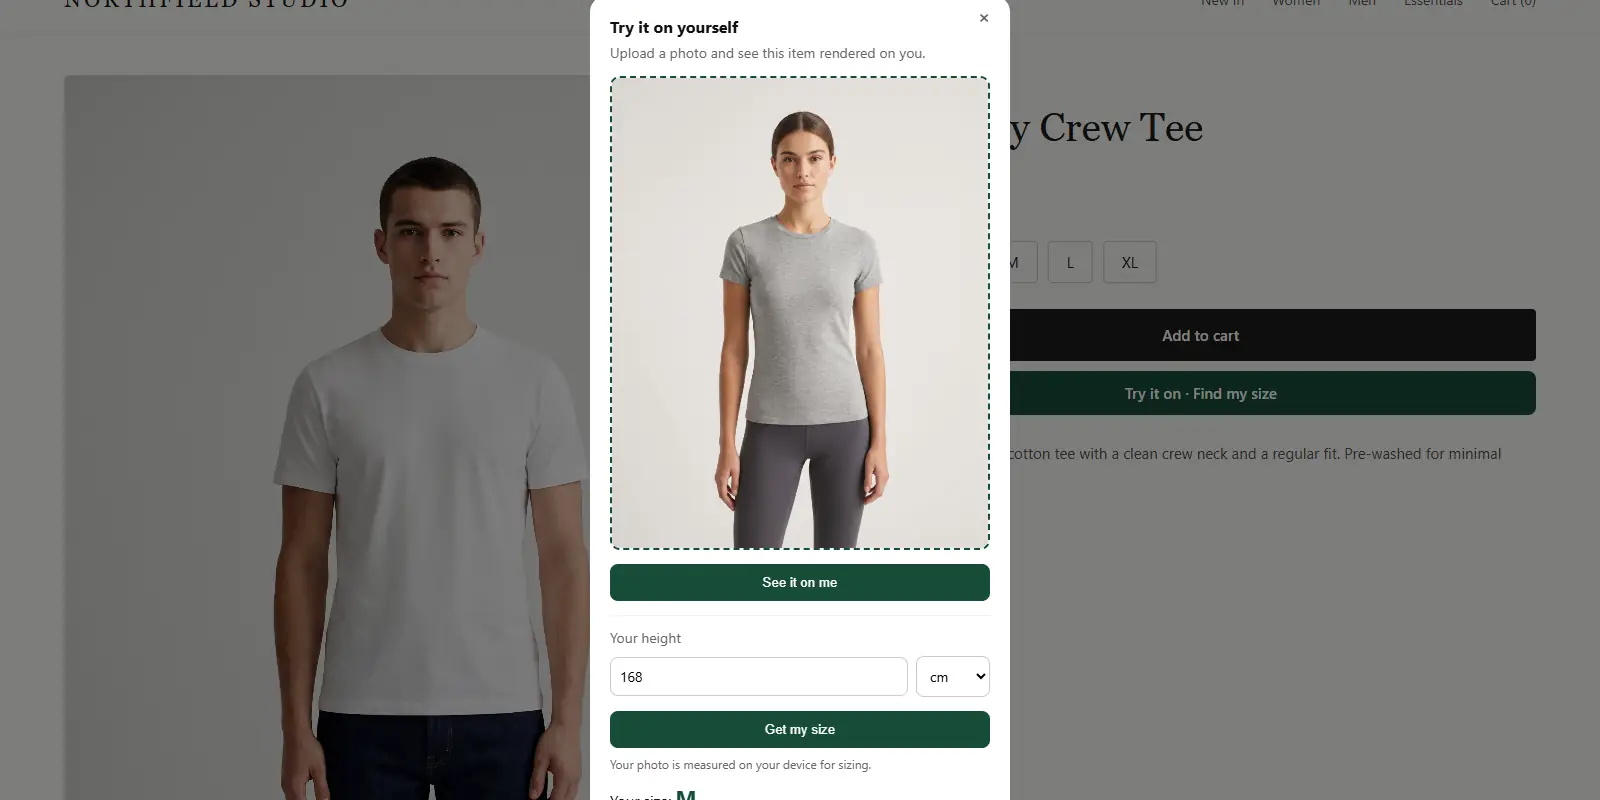
- For size returns: a clear size chart, fit notes, and a size recommendation that uses your own chart. ZeDaq.ai matches a 30-second body scan to your size chart and recommends your labels.
- For not-as-described returns: accurate color photos, fabric details and a visible product page checklist. See the product page checklist.
- For repeated problem products: fix the listing, adjust the chart, or retire the product.
We do not claim any specific return reduction from a tool. Measure your own results against your baseline.
Test size recommendations on your own products
FAQs
Is there one ideal return rate for fashion?
No. It depends on your product mix, price points and return policy. Compare with your own past months first.
Should I count exchanges as returns?
Choose one rule and keep it. Many stores track exchanges separately because they keep the sale.
How often should I review the target?
Review monthly while you are building a baseline. After that, quarterly is usually enough unless something changes.
Do all returns cost the same?
No. Costs depend on shipping, handling and whether the item can be resold. Track the cost per return too, not only the rate.
Try ZeDaq.ai free
Virtual try-on and Find my size for your store, plus client, order and invoicing tools for tailors, in one subscription.