Try-On Engagement Rate: What It Is and How to Track It
By the ZeDaq.ai team · · 4 min read
On this page
Try-on engagement rate is the share of shoppers who start a virtual try-on out of the shoppers who could have. To track it, divide try-on starts by product-page views where the try-on button was available.
There is no single official definition, so write down yours, keep it fixed and track it the same way each week. This guide is for stores running a virtual fitting room on a clothing website who want a simple way to track use.
What counts as an engagement?
Pick one action and stick to it. Common choices are:
- Start: the shopper taps the try-on button.
- Upload: the shopper submits a photo.
- Result viewed: the shopper sees the rendered image.
The start is the easiest to measure and the most comparable between products. Use uploads or results as a second, stricter measure.
How do you calculate it?
Use this formula:
Try-on engagement rate = try-on starts ÷ eligible product-page views
Eligible means the page showed the try-on button. Leave out pages without it, or the rate will look low for the wrong reasons.
A worked example
This example uses made-up numbers to show the method. They are not benchmarks.
Suppose a dress page had 200 eligible views in a week, and 20 shoppers started a try-on. The rate is 20 divided by 200, or one in ten.
Now suppose 12 of those 20 saw a result. The completion rate is 12 divided by 20, which is three in five.
Which related metrics matter?
Track the funnel step by step, not just the first rate.
| Metric | Formula | What it tells you |
|---|---|---|
| Engagement rate | Starts ÷ eligible views | Is the button noticed and trusted? |
| Completion rate | Results ÷ starts | Does the flow work? |
| Cart rate after try-on | Carts ÷ results | Does the result help buying? |
Your analytics tool may have a metric with a similar name. Check its definition so you don't mix the two up.
How do you track it?
You need an event for each step. The guide on which events to track in GA4 gives names, parameters and a testing method.
Set up the tracking yourself with your analytics tool or tag manager. ZeDaq.ai doesn't provide this analytics for you, so don't expect it as a built-in report.
What affects the rate?
Several things change how many shoppers try the feature:
- Button position. Near the product photos is easier to find.
- Button label. "Try it on" is clear and short.
- Product type. Fitted garments invite more testing than loose ones.
- Device. Phones need a quick upload flow.
- Trust. A line about how photos are used reassures shoppers.
Compare like with like. Dresses and sunglasses will not behave alike. For stores that sell glasses, the eyewear try-on for independent opticians article explains the live-camera version.
Try the button as a shopper would
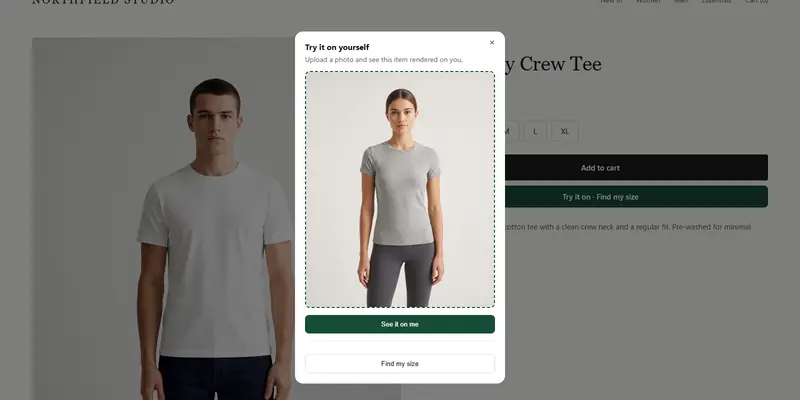
Try it on yourself
Live renderUpload a photo, pick a piece, see it rendered on you.
Pick something to try on
What are common mistakes when measuring it?
Most errors come from counting the wrong thing. Watch for these:
- Counting all page views. Pages without the button make the rate look lower than it is.
- Counting your own team. Filter out staff visits and test sessions.
- Changing the definition midway. You can no longer compare weeks.
- Mixing devices. Phone and desktop behave differently, so compare each on its own.
- Reading one product alone. A single page has too little traffic for a firm conclusion.
How should you segment the data?
One store-wide number hides a lot. Split the rate by:
- Product type, such as dresses, tops or bottoms
- Device, phone versus desktop
- Traffic source, such as social, search or email
- New versus returning visitors
A low overall rate may come from one weak product group. Segments show you where to look first.
How often should you review it?
Weekly is enough for most small stores. Review the funnel together, not each rate alone, and note any change you made to the page that week.
Avoid reacting to a single day. Small stores see wide swings because traffic is low, so wait for a full week or more before you change anything.
How do you improve a low rate?
Change one thing at a time and compare week to week.
- Move the button higher on the page.
- Test a clearer label.
- Add a short note on what the shopper will see.
- Start with the products where fit matters most.
Stores on WordPress can add the feature with a script tag, as explained in virtual try-on for WooCommerce. ZeDaq.ai has a Free plan at $0 with 3 try-ons a month, so you can test the flow before you track anything at scale.
Test the shopper flow before you measure it
FAQs
Is there a good engagement rate to aim for?
There's no universal figure. Compare your own products over time instead of chasing someone else's number.
Should I count repeat users?
Count each try-on start. If you want unique shoppers as well, track a second version based on users.
Does a high rate mean the feature works?
Not on its own. It shows interest. Check completion and cart rates to see whether the try-on helps shoppers decide.
How long should I measure before deciding?
Run it long enough to cover a full cycle of normal traffic, such as several weeks, and avoid sales periods that distort behavior.
Try ZeDaq.ai free
Virtual try-on and Find my size for your store, plus client, order and invoicing tools for tailors, in one subscription.