How to Build a Size Chart From Scratch for a New Brand
By the ZeDaq.ai team · · 4 min read
On this page
- What should your size chart measure?
- How do you choose a base size and fit model?
- How does grading work?
- Why do you need separate charts per garment type?
- How do you test the chart before launch?
- What do you do when someone falls between sizes?
- What mistakes do new brands make with size charts?
- Will a chart alone do the job?
To build a size chart from scratch, pick a base size, measure a fit model's body, decide how much each size grows, then fill the rest of the range and test it on real people. Record body measurements, not flat garment widths, and keep a separate chart for each garment type.
This guide is for founders without a pattern maker's chart. A clear chart is the base that any AI size recommendation tool needs, since the tool can only suggest sizes your chart defines.
What should your size chart measure?
Decide first whether your chart lists body measurements or garment measurements. For online sizing, use body measurements: the chest, waist and hips of the person who fits that size. Shoppers can measure themselves, and body-scan tools compare against the same numbers.
You can still keep garment measurements in your pattern notes. They are for your production team, not for the chart shoppers see.
How do you choose a base size and fit model?
Your base size is the one you design first, often a medium or a size 8 or 10. Everything else is graded from it.
Pick a fit model whose body matches the base size, and measure them with a soft tape: chest or bust, waist, hips, and for bottoms, inseam. Take each measurement twice. Our guide to common measurement mistakes lists the errors that skew numbers.
How does grading work?
Grading means adding or subtracting a fixed amount between sizes. For example, each size up adds the same step to the chest. Grading keeps the range consistent, so a large looks like a scaled medium.
Steps to follow:
- Choose a step per measurement (chest, waist, hips).
- Add it going up from the base size and subtract going down.
- Check that the ranges meet, with no gaps and no overlaps.
- Adjust steps in the extremes, since bodies don't scale evenly.
The table below is an illustrative example of the layout only, not a standard. Check your own brand's measurements.
| Size | Chest (cm) | Waist (cm) | Hips (cm) |
|---|---|---|---|
| S | 86 to 91 | 70 to 75 | 92 to 97 |
| M | 92 to 97 | 76 to 81 | 98 to 103 |
| L | 98 to 103 | 82 to 87 | 104 to 109 |
Each size covers a range, because real bodies vary. This is an example chart; your fit decides your numbers.
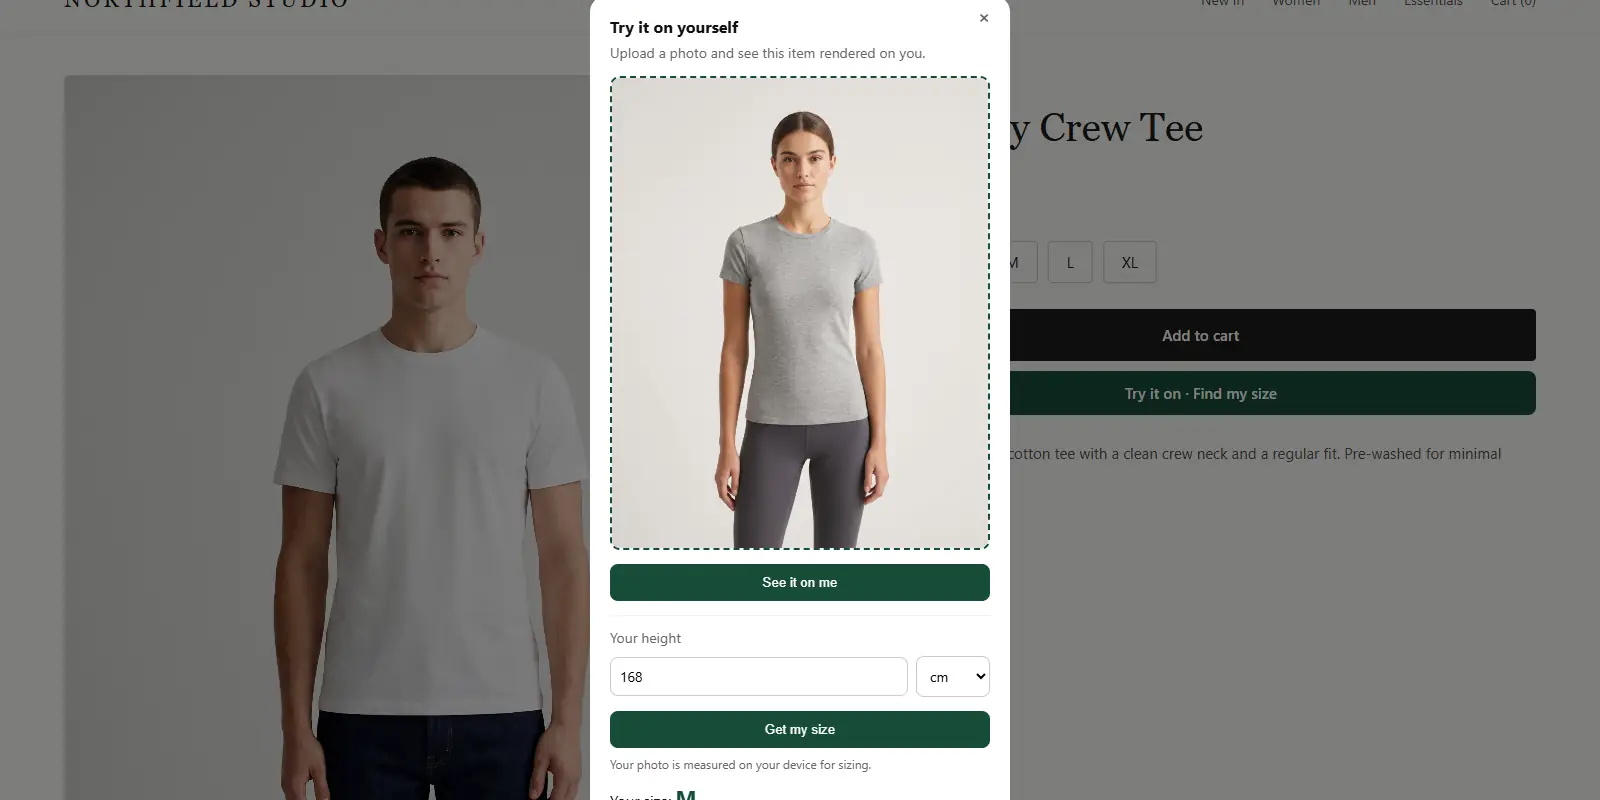
Test how a scan reads your chart
Try it on yourself
Live renderUpload a photo, pick a piece, see it rendered on you.
Pick something to try on
Why do you need separate charts per garment type?
Tops, jackets, dresses and trousers fit differently. A hoodie that is relaxed in the chest shouldn't use the same ranges as a fitted shirt. In ZeDaq.ai, merchants enter one chart per garment type: tops, outerwear, dresses and bottoms.
Specialist garments need their own logic. Read how to interpret a maternity size chart and the thobe and jilbab size chart before applying a general chart to them.
How do you test the chart before launch?
- Measure at least a handful of real people across your target range.
- Check which size your chart assigns each person.
- Ask them to try the garment in that size and report the fit.
- Fix ranges where the answer was wrong, then repeat.
Testing on people outside your friend group matters, as friends often resemble your fit model.
What do you do when someone falls between sizes?
Decide the rule now. A common rule is to recommend the larger size, since a slightly loose garment is easier to wear or alter than a tight one. ZeDaq.ai follows this, sizing up to the largest relevant measurement. Write the rule on your chart page, so shoppers know why.
What mistakes do new brands make with size charts?
A few errors repeat across new brands:
- Charts based on garment width. A shirt may measure wider than the body that wears it, so the shopper compares the wrong numbers.
- One chart for everything. A single table for tops, jackets and trousers hides real differences.
- Gaps between sizes. If one size ends and the next begins with a break, some shoppers fall in between.
- No fit note. A line such as "runs small" is cheap and useful.
- Never updating. After the first few hundred orders, use feedback to adjust ranges.
Keep a change log of every edit to the chart, with the date and the reason. It helps you spot patterns later.
Will a chart alone do the job?
A chart helps shoppers choose, but it asks them to measure themselves. For how the two approaches compare, read virtual try-on versus size charts.
Add your chart and test a body scan
FAQs
How many sizes should a new brand offer?
Start with a small range you can fit well, then add sizes once you have feedback. A smaller range with accurate ranges beats a large one with gaps.
Should I copy another brand's chart?
No. Fits differ between brands, so a copied chart gives wrong answers for your garments. Build yours from your own fit model.
Do I need a pattern maker?
It helps, but you can begin with a fit model, a tape and careful testing. A pattern maker is useful for grading beyond your base range.
Should the chart use inches or centimeters?
Use the unit your shoppers use, or show both. ZeDaq.ai lets you enter charts in either.
Try ZeDaq.ai free
Virtual try-on and Find my size for your store, plus client, order and invoicing tools for tailors, in one subscription.